Winner of Corsica - National Dataviz Contest
Jul 4, 2022
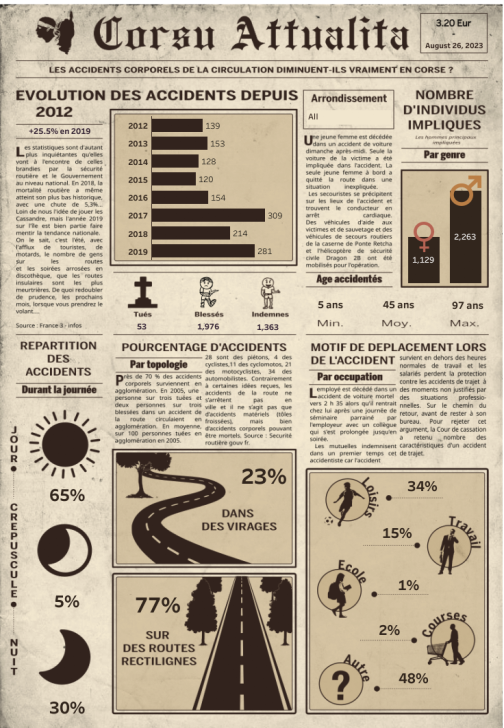
Delighted to share my victory in the Opendata Corsica Data Visualization Contest. My artistic approach effectively showcased multi-department accident data on a single page, elegantly addressing filter challenges. A newspaper-style layout dynamically responds to user preferences. Users can district-filter via the menu and a click on the primary bar chart sorts by year, swiftly adapting displayed data. This achievement underscores my commitment to user-friendly data presentation.
SQUARE ENIX – Playtest Data Visualisation
Aug 10, 2019
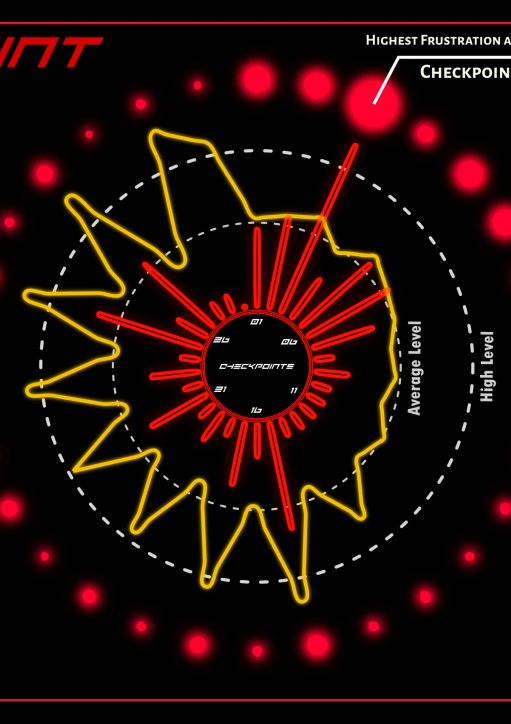
Presenting the Square Enix – Playtest Analysis project's data visualization, meticulously crafted to encapsulate the breadth of insights gleaned from the playtest analysis. This visually engaging representation serves to enhance comprehensibility. Designed using Tableau Software, seamlessly integrated with Inkscape for an aesthetically pleasing outcome, this visualization empowers users to effortlessly compare four pivotal variables within a singular depiction.
STEEP - XBOX Cross Purchase Analysis
Jun 15, 2019
Presenting a succinct dataviz analysis focused on STEEP, a captivating game that resonates with those who relished Coolboarder during their formative gaming years. This analysis zeroes in on the Xbox purchasing habits of STEEP's players. Employing a custom tool, I delved into this exploration. Regrettably, due to privacy considerations, not all data can be unveiled within this dataviz..
SQUARE ENIX – Interactive Business Presentation
Jan 21, 2019
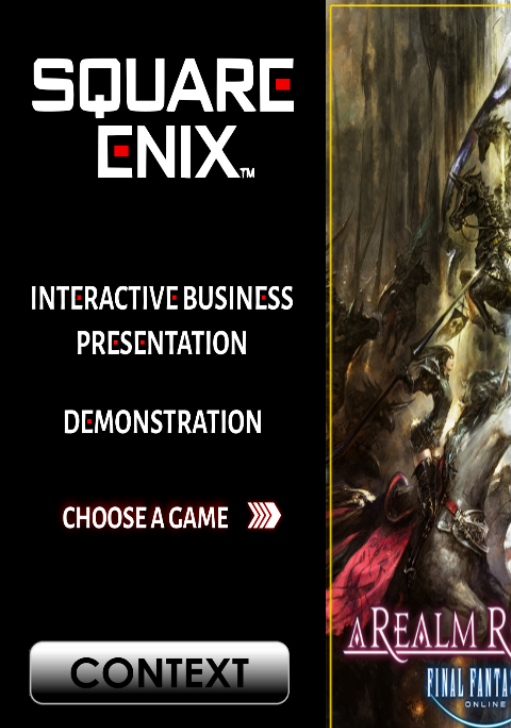
Greetings everyone! In my ongoing endeavor to move beyond traditional PowerPoint presentations, I've explored an intriguing alternative: the realm of highly customizable and interactive presentations. This innovative approach addresses the limitations of linear presentations, where accessing previously discussed information can be cumbersome. With this new format, information is always within 1 to 3 clicks, allowing for effortless navigation and seamless access to all available content.
Monster Hunter World Main Story Trophy Analysis
Jul 31, 2018
In this analysis, my focus shifted towards Monster Hunter World data, emphasizing the potential of Data Scraping The objective was to glean insights from a comprehensive extraction of data from over 100,000 PlayStation 4 players who engaged with Monster Hunter World. By examining player departure patterns, particularly through the lens of trophies, I aimed to decipher the reasons and timing behind players' decisions to discontinue gameplay.
Little Nightmares – First Month Post-Mortem
May 29, 2017
In April 2017, Bandai Namco introduced a new Intellectual Property named "Little Nightmares," drawing inspiration from the successful title "Limbo." Despite not being a pioneer in its genre, I sought to gauge the reception of "Little Nightmares" a month post-release. Utilizing data extracted from Steam and YouTube, this analysis sheds light on its impact and reception within the gaming community.
Dark Souls III Content, Price and Sentiment Analysis.
May 29, 2017
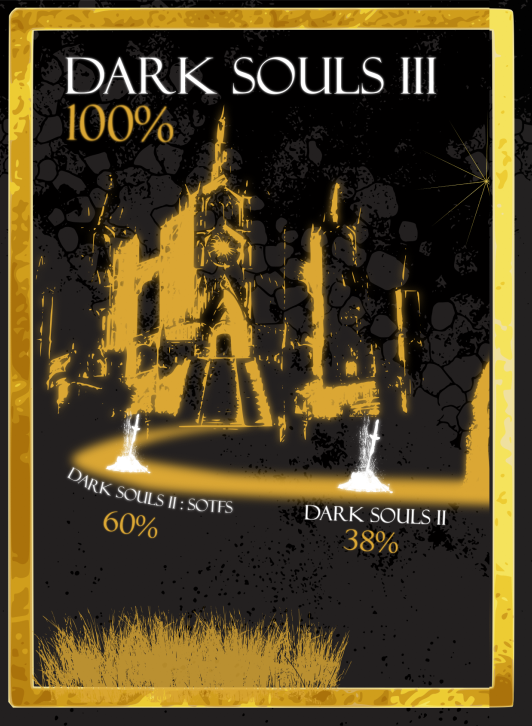
Post-release of all DLCs, this analysis delves into Dark Souls III, exploring the impact of pricing and added lore on player sentiment. We collected user feedback from Steam and Xbox Live using a dedicated crawler and harnessed advanced Natural Language Processing (NLP) algorithms for insights.
ELDEN RING Player Base Analysis
Jun 12, 2020
Unveiled at E3 2019, Hidetaka Miyazaki's collaboration with George R. R. Martin, "Elden Ring," has garnered significant anticipation. While details remain shrouded, I strive to forecast the transition of Dark Souls III's core players to this upcoming epic. Leveraging a proprietary tool, data remains confidential due to business and privacy considerations. This analysis seeks to elucidate the potential crossover between the two games' player communities.
SQUARE ENIX – Playtest Analysis
Aug 10, 2019
This commissioned analysis, concluding my Square Enix series, delves into player reactions during the developmental/beta stage of a game. The analysis focuses on gauging game difficulty perception and identifying player concerns. Employing PowerBI and Tableau, the findings are visually presented for maximum impact. The document showcases the synergy of economics and statistics, providing insights that transcend surface-level observations.
Magazine Report Analysis (7 hour Challenge
Mar 25, 2019
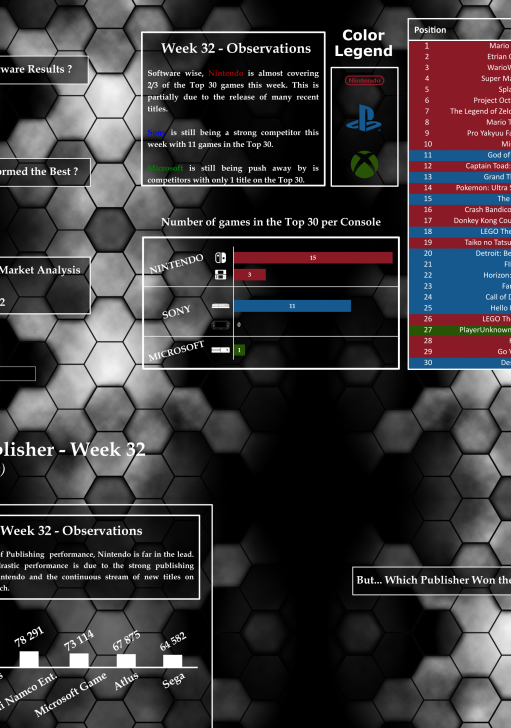
After a hiatus, I'm back with a reimagined analysis on interactive presentations. I crafted a digital magazine in just 7 hours, blending traditional data with modern design.My aim? Get rid of PowerPoint in favor of engaging digital magazines, inspired by newspapers "The Sanahunt". This experiment unveils insights into Square Enix's player behavior and tests the viability of a fresh approach to corporate communication.
Making an Animatic – VGChartz Week 32
Sep 17, 2018
This analysis represents my initial foray into animation using Blender software. Despite my novice status, I aimed to master fundamental animation techniques to create a polished presentation. While the outcome features an animation, challenges include compromised video quality due to hardware limitations, lingering errors such as typos and animation inconsistencies, and less pertinent data sourced from VGChartz
Monster Hunter World PSN Platinum Trophy Distribution
Aug 14, 2018
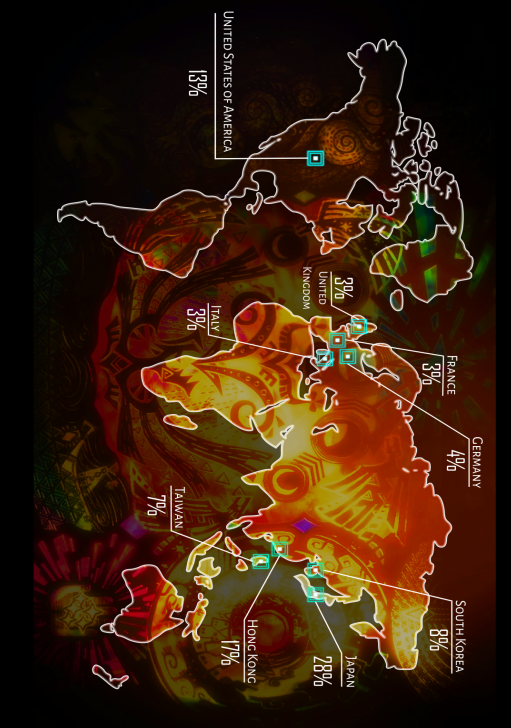
Building upon the Monster Hunter World Main Story analysis, I sought to enhance the perspective of PSN Players. Through a thematic world map using a choropleth-like technique, I illuminated player involvement across global regions. The map highlights platinum trophy distribution by country, focusing on those with shares exceeding 3%..
Resident Evil 2 : Remake – E3 Trailer Analysis
Jun 22, 2018
As a long-time enthusiast of the Resident Evil series, the debut of the Resident Evil 2 Remake trailer at E3 brought immense satisfaction. Recognizing the potential for insights, I employed Natural Language Processing (NLP) to analyze viewer sentiments from the top 3 YouTube videos associated with Resident Evil 2: Remake. This concise analysis focuses on capturing emotions expressed in comments, with data sourced directly from YouTube through a tailored scraper.


